
In this post Alan Renwick assesses the performance of the first-past-the-post electoral system at last week’s general election. Focusing on eight criteria, he concludes that the problems generally associated with FPTP were milder in this election than in other recent elections. However, by failing to produce the single-party majority government that its proponents argue is a major advantage over proportional alternatives, the case for FPTP was nonetheless weakened.
Amidst all the profound issues affected by the election results – not least Brexit, the governance of Northern Ireland, and the sovereignty question in Scotland – the performance of the electoral system is not perhaps the most pressing. Nevertheless, a routine health check is in order. Did the electoral system perform better or worse this time than in other recent polls? Did this election strengthen or weaken the case for reform?
Any analysis of performance requires some assessment criteria. Many criteria could be used. In this post, I shall focus on eight of the most important.
1/ Single-party majority
The House of Commons is elected by first past the post (FPTP). While acknowledging its imperfections, supporters of FPTP argue that it has at least one crucial advantage over its proportional rivals: it generally produces single-party majorities, which, they say, help deliver (to coin a phrase) strong and stable leadership.
Clearly, that did not happen this time. Indeed, this was the second election in three that failed to perform as FPTP backers expect. Political scientists pointed out long before the first of those elections, in 2010, that the decline of the UK’s traditional two-party system since the 1970s had made such outcomes more likely. It is noteworthy, therefore, that this time we have a hung parliament even though two-party politics appears resurgent: the vote share of the two largest parties, at 82.4 per cent, is higher than at any election since 1970, and 17.4 percentage points up on the low of 2010. But though multipartism has declined, it has not disappeared: the minor parties still hold over 10 per cent of the seats – a higher proportion than at any post-war election before 1997. Unless things change dramatically, results such as this are likely to become fairly normal.
2/ A government with popular support
The flipside of the coin of so-called ‘manufactured’ majorities is the possibility that FPTP can give power to a government that commands only minority support among voters. Concern about this possibility reached its height in 2005, when Labour secured majority power on only 35.2 per cent of the votes cast and, given low turnout, just 21.5 percent of the eligible electorate.
This time, the Conservatives won 42.4 of the vote. Despite the failure to secure a majority of seats, that is one of the highest vote shares since 1970: only Margaret Thatcher in 1979 and (very marginally) 1983, and Tony Blair in 1997 did better. Theresa May’s party captured the votes of 29.1 of the eligible electorate. While this is the highest share secured by any party this century, it is lower than the share of any winning party between 1945 and 1997 except Labour in October 1974, owing to diminished turnout.
3/ Proportionality between votes and seats
While FPTP’s supporters favour it above all because of its support for single-party governments, its detractors’ main criticism is its disproportionality: its failure to produce a close match between the parties’ shares of the votes and their shares of the seats. At the 2015 election, for example, UKIP famously secured just one seat despite receiving more than an eighth of all votes.
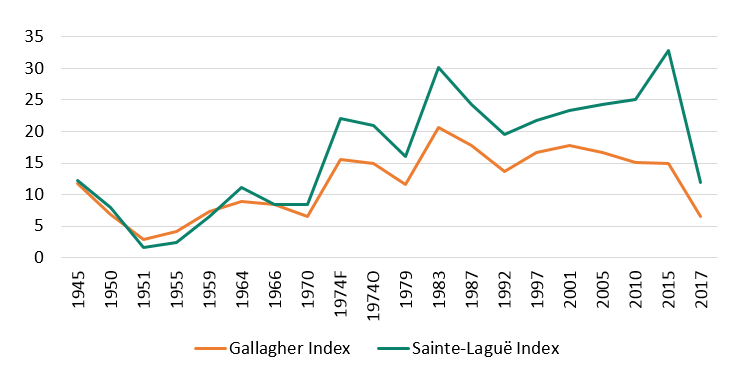
Disproportionality at UK general elections since 1945
Using the standard measure of electoral disproportionality – the so called Gallagher index – last week’s election was, as the figure below shows, the least disproportional since 1955. Using an alternative measure called the Sainte Laguë index, which I have suggested elsewhere has some advantages over the Gallagher index, it was the least disproportional only since 1970. Whichever measure we use, the level of disproportionality seen this time is not markedly higher than that found in many countries employing systems of proportional representation (PR). Indeed, it is lower than in any of the European Parliament elections in Great Britain since PR was introduced in 1999. The reduction in disproportionality is, for the most part, a reflection of the shift back towards two-party politics: FPTP is much more likely to distribute seats in rough proportion to votes if those votes are overwhelmingly cast for only two parties.
4/ Choice for voters
At the same time, we may be concerned that this proportionality has been achieved at a cost: it may be that voters have felt forced to back one of the two main parties because otherwise, under FPTP, they will ‘waste’ their votes. That limits voters’ ability to influence the result as they truly wish.
There is no doubt that some voters did vote tactically in this election, and that some of these felt pushed by the electoral system into casting a vote that they found distasteful. There was clearly some tactical voting among the putative ‘progressive alliance’ parties’ candidates, as evidenced by large increases in Liberal Democrat vote shares in a few seats where they were competitive. Anti-SNP tactical voting is also evident in Scotland. But just how widespread tactical voting was is difficult to judge. The Electoral Reform Society suggested just before the election that around a fifth of voters planned to vote tactically, and that this was more than double the rate in 2015. But such analysis has to be treated with caution. The survey question on which the ERS based this claim (available here) does not clearly distinguish tactical from protest voting, and the comparison with 2015 is based on a different question that might be expected to yield different answers. Certainly, some tactical voting took place in this election, but it would be wise to wait until detailed data are available from the British Election Study before attempting any conclusions on its level.
5/ Representation of society
FPTP is often criticised for failing to promote representation of society in all its diversity. Each party has only one candidate in each constituency and will therefore seek the candidate who it believes will appeal to most voters. Given stereotypes and expectations, that is most likely, on the traditional view, to be a white male. Under proportional systems, by contrast, each party puts up a slate of candidates, and has an incentive to ensure that slate includes a range of different people.
As work by my colleague Jennifer Hudson shows, 208 of our 650 new MPs are women. This is a new record and the first time the 200 mark has been passed. At 32 per cent of MPs, it puts the House of Commons ahead of the European average reported by the Inter-Parliamentary Union, but behind most of the long-standing democracies of north west Europe that should be our comparators. The House of Commons is also still behind the Scottish Parliament, Welsh Assembly, and the UK delegation to the European Parliament, all of which use more proportional systems, though it is marginally ahead of the Northern Ireland Assembly.
Dr Hudson’s research also shows a record number of BME MPs, at fifty-two. Meanwhile, research by Andrew Reynolds from the University of North Carolina reports that forty-five out LGBT candidates have been elected, which, at 6.9 per cent of the total, is a world record. By contrast, though detailed figures are not yet available, it is likely that representation of socio-economic classes remains skewed and that the pattern of low working class presence in the Commons continues.
The degree to which variation in social representation can still be attributed to the electoral system is unclear. Certainly, that the world’s highest rate of LGBT representation should be found in a country using FPTP is not what theory would predict, and the parties have all actively sought to address the underrepresentation of women and ethnic minorities within the constraints of the existing system. On the whole, however, proportional systems do still appear to do somewhat better.
6/ Exaggeration of regional disparities
Another longstanding concern about FPTP is that it can exaggerate differences between voting patterns in different parts of the country, thereby helping to pull the nations and regions apart. There was much comment after the 2015 election that, for the first time, four different parties had come out on top in the four nations. Furthermore, in several parts of the UK in that election, one party came close to sweeping the board without a commensurate vote share: the SNP secured 56 of the 59 Scottish seats with 50.0 per cent of the vote there; in the South East and South West of England, the Conservatives won, respectively, 78 out of 83 seats and 51 of 55 seats with 50.8 and 46.4 per cent of the vote; in the North East, Labour picked up 26 of 29 seats with 46.9 per cent of the vote.
Last week’s election again saw victory (in terms of votes and seats won) for four different parties in the four nations. But many of the disparities have diminished. In Scotland, the SNP now have only 35 seats with 36.9 per cent of the vote. In both the South East and the South West, the Conservatives’ vote shares rose (to 54.0 and 51.4 per cent) while their seat tallies fell (to 72 and 47), such that their overrepresentation declined. In the North East, Labour’s seat number held constant, but this time was based on a higher vote share, of 55.4 per cent. The exaggeration of regional disparities thus remains a reality, but is less pronounced than last time.
7/ Accountable MPs
Supporters of FPTP praise it for ensuring that every MP is accountable to local voters and can be removed from office if those voters are dissatisfied with her or his performance. FPTP detractors, however, point out that this often fails to work in practice, as many seats are safe for a given party: that party’s candidate will be elected in all but the most extreme circumstances.
We can examine this by looking at the proportion of seats that are marginal. This proportion has fallen somewhat over time: between 1950 and 1974, an average of 15.0 per cent of seats had margins below five percentage points and 29.8 per cent had margins below 10 percentage points. Between 1979 and 2015, the equivalent figures were 11.6 per cent and 24.1 per cent.
Last week’s election saw particularly large numbers of ultra-marginals: eleven seats now have majorities under 100 votes, up from three in 2015. Overall, 14.9 per cent of seats have margins below five per cent – the highest figure since October 1974 – and 26.0 per cent have margins below 10 per cent. There are, of course, still some extremely safe seats: thirty-five seats (all but one of them held by Labour) have margins above 50 percentage points. But the problem is somewhat less widespread than in many recent elections.
8/ Turnout
Cross-national studies find that electoral turnout tends to be lower under FPTP than under proportional systems. The reasons for this are not entirely clear, but one factor may be the frequency of safe seats under FPTP: voters in such seats may think there is little point in their going to the polling station, as the result is a foregone conclusion.
Turnout rose at this election for the fourth successive time; at 68.7 per cent, it was the highest since 1997. Nevertheless, the collapse in turnout seen in 2001 – from 71.4 per cent to 59.4 per cent – has not yet been fully reversed, and turnout is still lower than at any general election between 1945 and 1997. This level of turnout is lower than in most – but not all – long-established European democracies.
To gauge whether seat safety makes a difference, we can look at the correlation between turnout and the winning margin in each constituency. A full examination would require multivariate analysis, which I will not attempt here. But simple bivariate analysis shows no correlation between turnout and marginality. Some of the safest seats in the country – such as Bootle and Liverpool West Derby – in fact showed turnout slightly above the national average. It is difficult, therefore, to detect any negative effect of the voting rules on turnout at this election.
Conclusion
Overall, the problems generally associated with FPTP were milder in this election than in other recent elections. Most notably, disproportionality is unusually low. In addition, the government’s popular support base is larger than in other twenty-first century elections, society is, at least on some dimensions, better represented, regional disparities are less severe, and fewer MPs have safe seats. Whether more voters felt pushed into voting tactically is unclear, as is any effect of the system upon turnout.
This election does not therefore strengthen the case against FPTP. At the same, however, it does weaken the case for FPTP. That case is based in significant part on the claim that this system fosters single-party majority government, but this election, as that in 2010, failed to deliver that outcome. If FPTP continues to produce minority governments, it will become less obvious why its disadvantages ought to be tolerated.
About the author
Dr Alan Renwick is the Deputy Director of the Constitution Unit.
Pingback: After the general election: what’s next? | The Constitution Unit Blog
It serves no purpose to talk about proportionality and percentage of the popular vote since these aren’t things under FPTP and distort how Westminster systems of government work. We don’t elect governments, we elect individual MPs. It’s not one single election, it’s 650 separate elections that occur on the same day. Therefore there is 100% seat-vote correlation. Conservative candidates were successful in 317 contests (not including Mr. Speaker as he did not run as a Conservative), and thus end up with 317 seats. Trying to apply proportionality misses the point entirely. A national percentage of the popular vote is meaningless; only the percentage of the vote in each individual constituency might matter — the issue of individual candidates being elected with less than majority support. That’s where a ranked ballot might help to overcome this.
It would be good to compare the situation in the UK with other democracies such as Canada, Australia, etc that share many characteristics with the UK…